When an indicator “fights” with the actual price action traders can profit.
Sometimes a technical indicator will disagree or “fight” with the actual price action of the stock or index you are analyzing. These “disagreements” are actually very useful for technical traders. In this three part series we will discuss and learn how to apply these powerful technical signals called divergences
Trading divergences – Part One
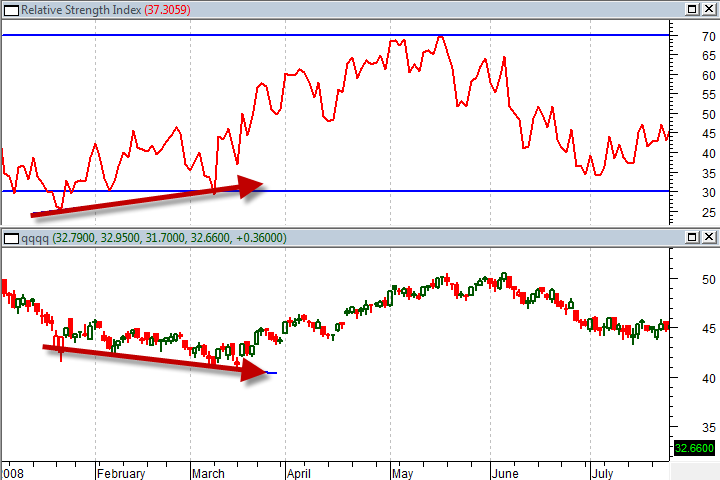
A divergence appears when a technical indicator (usually an oscillator) begins to establish a trend that disagrees with the actual price movement. For example, in the chart below you can see the QQQQ forming lower lows from January through March of 2008.
This is representative of a market that is becoming more bearish. However, the RSI technical indicator I have applied is showing a series of higher lows, which is indicative of an improving trend.

For QQQQ shorts, this is a warning that risk control is going to become much more important because there is a high probability that the trend will be disrupted in the short term.
For more speculative traders looking to get long the QQQQ or buy calls, this “bullish divergence” is an alert that a change in the trend may be emerging. In the video I will cover another great example of a bullish divergence like the one on the QQQQ but on an individual stock.
Traders use technical indicators like oscillators because they filter a lot of the noise within the price action. Oscillators are typically designed to show a trader when prices have reached extremes and a reversal is likely. However, how extreme is too extreme?
The disagreement or divergence between bearish price action (lower lows) and the trend of the oscillator (higher lows) is one way to answer that question. When this happens it indicates that investor sentiment is too extreme and a reversal to the upside is likely.
Divergences can happen to trigger trades both directions.
Divergences can be an important warning signal that a bullish trend is ending. In the last article I talked about how to use bullish divergences to time an entry into a new long position or to look out for weakness in a downward trend but there are also bearish divergences that long traders need to watch for.
Besides describing a bearish divergence I will further refine divergence analysis, in this article, to help you understand what types of divergences matter most and what you should be looking for on a day to day basis.
Trading divergences – Part Two
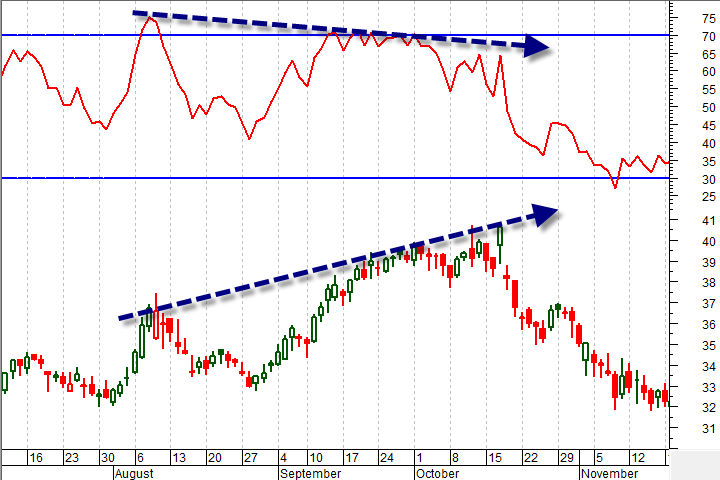
A bearish divergence occurs when prices continue to form higher highs (typical in a bull market) while your oscillator (in this case an RSI) is forming significantly lower highs (indicating weakness in the trend.)
We have further defined this signal as a period of diverging trends between prices and the indicator when the indicator has been making peaks in the “overbought” territory.
If you are using the RSI to look for divergences that means that you will pay the most attention to divergences when the indicator’s peaks are above 70 or “overbought.” You can see exactly this sort of formation and the resulting down trend on the chart below of Ebay (EBAY.)

There are two things that a technician can do once a divergence forms and prices start to drop. First, it is an opportunity for long traders to be proactive about their risk control. That may mean using tighter stops, protective options or just reviewing your portfolio to make sure you are properly diversified.
Second, a bearish divergence is a great timing signal for more speculative traders to get short the market or to buy put options. In either case, the signal has given you actionable information for your own portfolio management.
The basic rules for trading divergences are simple and can be applied to a number of different technical indicators
Divergences are fairly simple to identify and although they are not very common, they represent very important technical signals that the market or stock trend could change. This means that trend traders are taking measures to constrain their risk and more speculative traders are looking for an opportunity to trade a potential reversal. In this article I will review the basic rules of trading a divergence and provide a tip for finding divergences in the live market with technical indicators other than RSI.
Trading divergences – Part Three
Bullish divergence:
Both divergences look for “disagreement” between the technical indicator you are using and the price action itself. In the case of a bullish divergence, the signal occurs when the indicator is making HIGHER lows (becoming less bearish) while the price action itself is establishing LOWER lows.
The indicator is a more reliable representation of investor sentiment and is indicating that the market is overextended or “oversold” to the downside.
Bearish divergence:
The “disagreement” in this signal occurs when the indicator is making LOWER highs while prices are completing HIGHER highs. The indicator in this case is indicating that investors are becoming less bullish and therefore the market is overextending itself or “overbuying” to the upside.
Look for extremes:
A technical indicator will have many peaks and valleys. Those that matter most occur in extreme ranges. For example, in this series we used the RSI which is in “extreme” ranges when it is above 70 or below 30.
If a bearish divergence occurs when the RSI is in the upper extreme range bullish investors start looking to cover their positions a little more closely. Similarly, if the bullish divergence occurs with the RSI below 30 then bearish investors or short investors will start controlling their risk and market exposure more closely.
What if you aren’t using the RSI?
Not all technical indicators have a standardized extreme range like RSI does. The extreme ranges on RSI make it a convenient indicator for this kind of analysis but finding these same signals with your favorite oscillator is just as simple.
For example, many traders use a MACD or CCI as their preferred oscillator for trading the trend. Neither of these have an established extreme range because unlike RSI they do not oscillate within a constrained range of 1-100. In these cases look at recent history and try to find divergences in the oscillators when they are making tops or bottoms beyond the normal range.
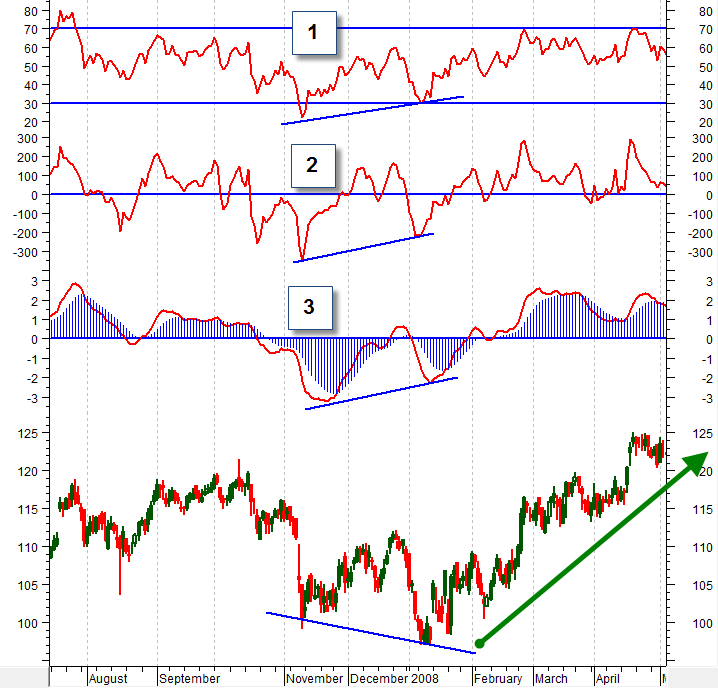
In the chart below, you can see a bullish divergence identified by an RSI setting higher lows (1) in the lower extreme range while the market was making lower lows. You can also see the same signal on a CCI which is hitting much more extreme lows (2) compared to recent history. Finally, the same thing is true on the MACD (3) as it extends below its recent range.
It is no coincidence that all three indicators are showing the same signal at the same time. Oscillators are all essentially measuring the same information in very similar ways. The differences are usually only a matter of personal preference. Some traders stick with RSI while others prefer MACDs or some other oscillator. This is a little like the choice between P/E ratios versus P/E/G ratios for fundamental analysts. Stick with what you are comfortable with.
IBM daily chart showing bullish divergence

Practice finding this pattern on your own using past data and then look for them to appear in the current market trend. In the video, I will go into a little more detail about what you are looking for in a technical divergence and how to use this signal regardless of what technical indicator you may favor.