Gaps create very strong levels of support and resistance
At Learning Markets we tend to focus more on price patterns, support and resistance and candlesticks over technical indicators when using technical analysis. This is useful because the data doesn’t lag like a technical indicator does.
Trading Gaps – Part One
When the price moves in a given market we can see buy and sell signals in real time using price patters rather than waiting for the data to be filtered over time within a technical indicator. Gaps are an example of a price pattern that can provide very dramatic trading signals.
Gaps occur when the market opens a session higher than the previous high or lower than the previous low. Gaps look like a blank space in a bar or candlestick chart between two trading sessions. They are most common in markets that close and do not trade overnight.
Gaps are sometimes ignored or misunderstood by traders. One of the reasons this may be true is the emergence of “gapless” markets like the Forex. However, once you understand the drivers behind a price gap, these same signals can be found within a “gapless” market as well.
To begin this series of articles I will define three of the most common gaps usually seen on a price chart. I am using Apple, Inc. (AAPL) in this case study so that you can evaluate the same signals within your own charting application as you practice identifying gaps.
Common Gaps
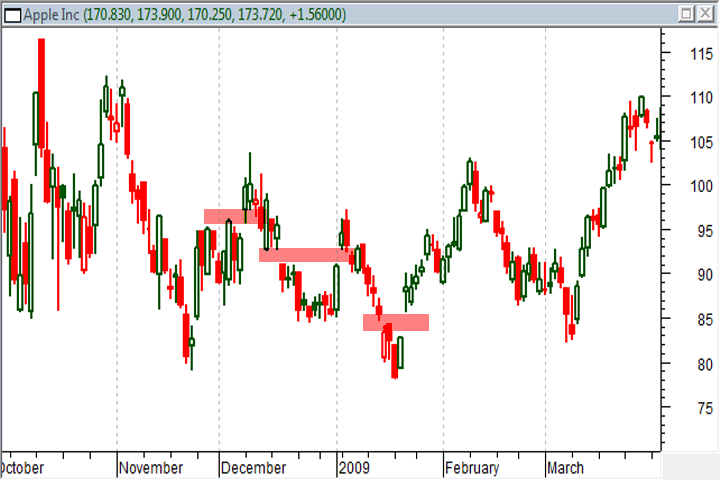
A common gap is usually small and occurs when a stock is channeling or consolidating in a tight range. In the chart below you can see an example of this kind of gap as the red areas on Apple, Inc. (AAPL). A common gap is not very useful because it occurs within a range bound market. Because range trading is very common this is the kind of gap you will see most often.
Breakaway Gaps
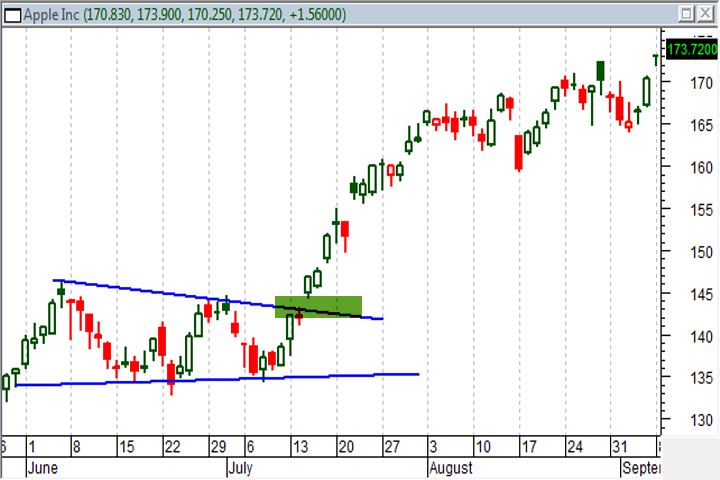
Periodically a stock will break out of a trading range and break support or resistance levels. When that occurs with a price gap the signal is definitely one traders should pay attention to. In the chart below you can see this kind of bullish breakaway gap on AAPL when the market broke out of a consolidation pattern and gapped above resistance.
Continuation Gaps
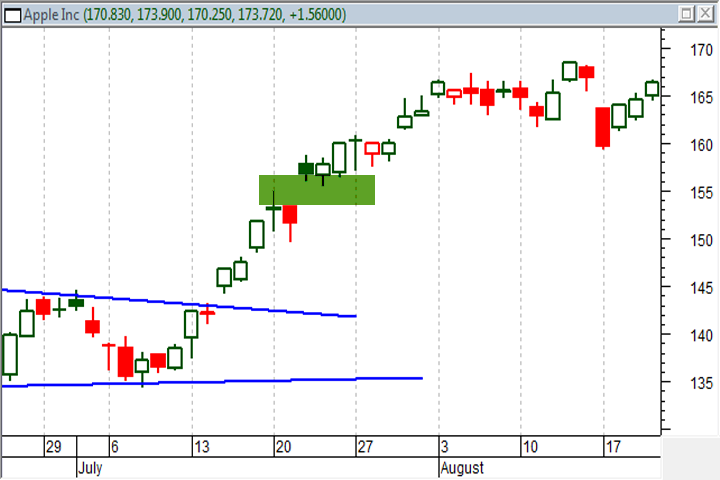
A continuation gap occurs when the market is already strongly trending one direction or the other and a gap between two trading periods occurs. Like breakaway gaps, a continuation gap to the upside is considered bullish and a continuation gap to the downside is bearish. In the chart below you can see a continuation gap that occurred after a breakaway gap in AAPL.
Gaps are caused by information or changes in investor sentiment that is released when the market is closed or not trading. This is seen most often in stocks and option markets where premarket and postmarket news is common. That news can change the perceived value of a stock and the buy/sell equilibrium will be different at the next open from the prior close.
In the next section I will cover some of the basic ideas around using gaps to identify support and resistance, buy signals and changes in investor sentiment. You will also learn how the causes of gaps can be identified in “gapless” markets so that the same signals can be traded there.
Breakaway gaps are useful indicators for a resumption of a trend following a consolidation pattern or an emerging new trend. These gaps happen when investor sentiment shifts strongly and usually represent a much larger than average price move. Because these shifts are so large they are usually accompanied by very large volume.
Trading Gaps – Part Two
In the last section I illustrated a breakaway gap occurring on Apple, Inc. (AAPL) that followed a short pennant formation. That is a very typical scenario for this kind of gap pattern to occur. You can see a second example of a breakaway gap in a similar situation in the chart below.
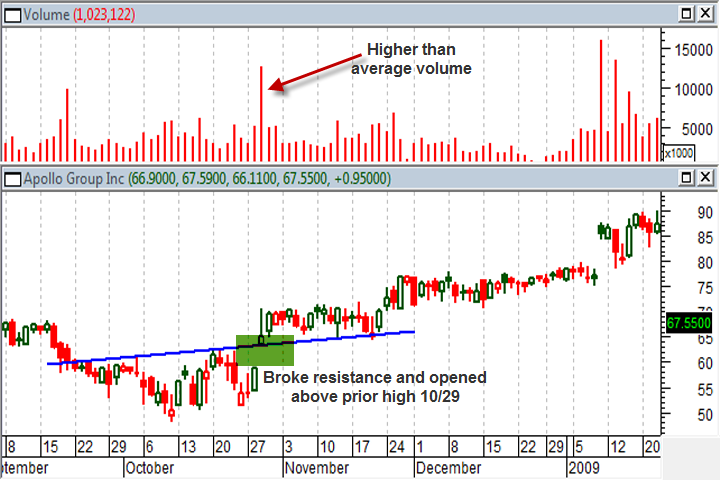
Apollo Group, Inc. (APOL) channeled between $50 and $60 a share for most of October. That channel was interrupted on 10/29 when the company filed its annual report with the SEC. The new information within the report was obviously good news for investors who moved into the stock forcing it to open above the previous high on strong volume.
A gap like this is clearly a bullish signal but it also establishes an inflection point on the chart that is likely to act as support in the future. It is common for a stock to continue higher following a breakaway gap and then return to the top of the gap and bounce higher again. You can see this on the chart above with a bounce in late November.
When this happens to the downside traders refer to it as a “dead cat bounce.” You can see an example of a bearish breakaway gap with a subsequent resistance bounce in the chart below. Shorting a stock at the initial gap or at the bounce is a strategy popular among shorter term traders.
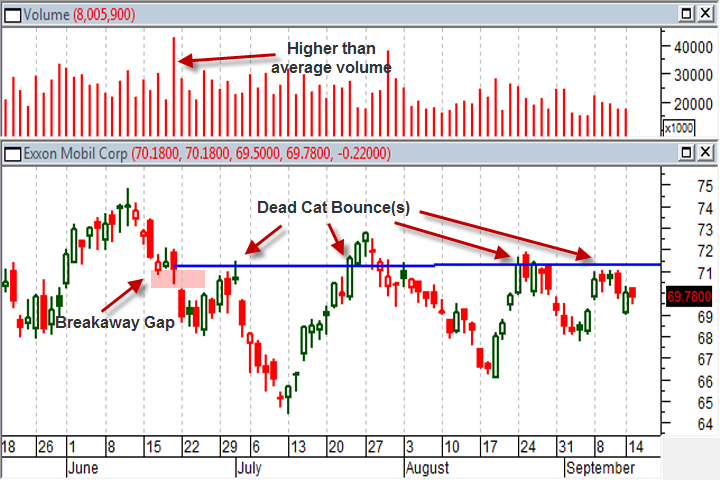
As you can see in the chart of Exxon Mobil (XOM) the break away gap on 6/22 occurred on high volume and ultimately lead to 4 moderate resistance (dead cat) bounces. A breakaway gap will frequently turn into a fairly solid support or resistance level and those levels should be monitored as the market approaches them.
Sometimes breakaway gaps will occur in a series of two opposing breakouts. These are often called island-reversals. An island reversal is a very important signal that sentiment in the market is overextended and a change in trend is coming. For example, a bearish island reversal would consist of a bullish breakaway gap followed by a short consolidation and then a bearish breakaway gap. You can see an example of this formation in the chart below.
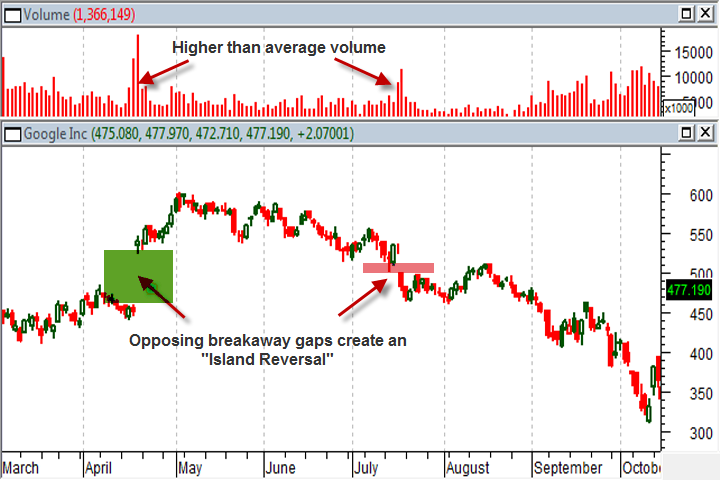
The breakaway gap that occurred in April on Google (GOOG) looked good but ultimately it only led to a downward sloping channel. Smart technicians could have turned this failed long position into a profitable short trade once the bearish breakaway gap in July turned this pattern into an island reversal.
A breakaway gap is most relevant when it occurs on a breakout from a consolidation or channel on higher than average volume and a larger than average price move. The conditions of a breakaway gap are not always as idealized as the examples shown in this article so take some time to practice identifying them on your own.
Like breakaway gaps, a continuation gap represents a shift in investor sentiment. Specifically, a continuation gap on higher than average volume represents renewed interest in the current trend. A continuation gap reflects that increased interest with higher than average volume and a bigger than average price move.
Trading Gaps – Part Three
Because a continuation gap occurs in the middle of a trend, it is a significant warning that risk is very high for counter-trend traders and may be an interesting entry opportunity for new trades. A continuation gap can occur within a down trend or an up trend. You can see an example of this kind of gap in the image below.
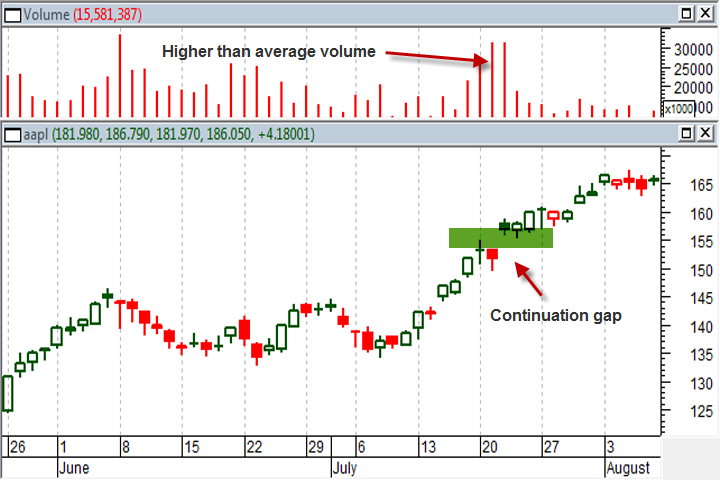
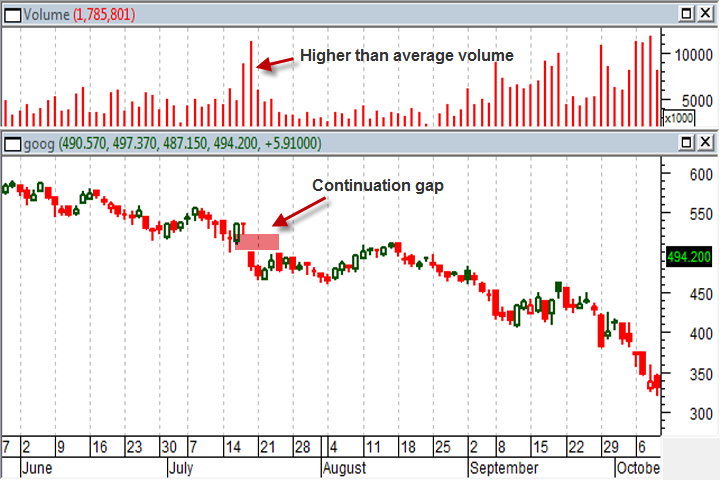
In the image above, Apple, Inc. (AAPL) gapped up in the middle of a trend. This continuation gap occurred following a breakaway gap a couple weeks earlier, which is not uncommon. The higher than average volume level confirmed the new buying demand behind this gap. The appearance of so many continuation gaps towards the end of 2008 was a big tip-off that the stock market was in serious trouble. You can see an example of this in the chart below.
You will find that like most analytical methods there is room for personal preference and interpretation. The definitions of breakaway, common and continuation gaps overlap and experience is needed before you will feel fully comfortable taking trades based on these price patterns. As you practice identifying gaps there are a few more concepts you should keep in mind.
Most gaps close… eventually
Gaps are like a vacuum on the price chart. Most large gaps will be filled within a year. The average time for a gap to be filled in the stock market is 3 months. This means that if a stock gaps down there is a very high likelihood that prices will come back up and through the gap within a year. The same is true of bullish gaps but in reverse.
This means that using gaps as a trading signal is a short term strategy. However, even long term traders can benefit from the analysis by using gaps to time new entries or periods of time when risk is higher and hedging is needed.
Not all markets gap
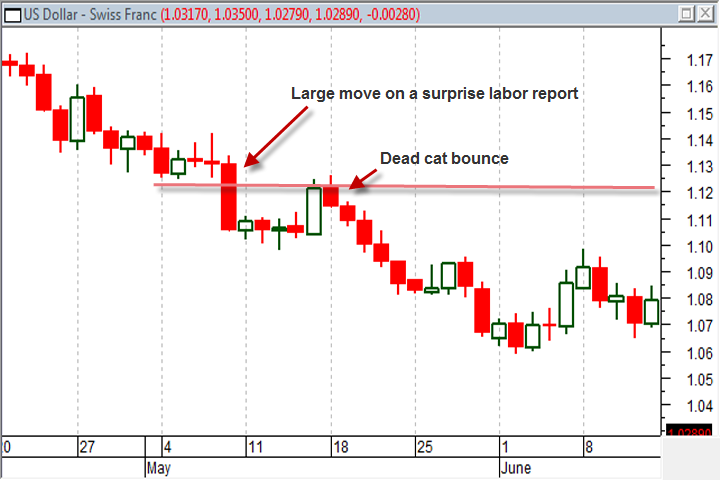
The retail forex is a classic example of a “gapless” market because it is open 5 days a week and 24 hours a day. However, the same psychology that causes a gap in stocks exists in the forex. A much larger than average move following unexpected news represents the same kind of underlying forces that cause a gap in a stock’s price. You can see an example of a continuation “gap” and dead cat bounce in the chart of the USD/CHF currency pair below.
Volatility = Higher Risk
An immutable law of the markets is that when there is greater profit potential there is higher risk. Gaps are inherently volatile and unusual market volatility is hard to predict. Gaps are attractive trading opportunities because the subsequent price moves can be very large. However, sudden reversals, market exhaustion and whipsaws are also common.
Some traders may use stop losses and tight money management to deal with this risk while others may use options to try and limit risk. In either case, the important principle is to control your risk and to be alert to changes in the market. Practicing gap trading in a paper-trade account is also a good way to make sure you understand the risks and nuances of trading short term price patterns like gaps before putting real money at risk.